...
Starting Odysseus Spatial
You can download Odysseus here: http://odysseus.informatik.uni-oldenburg.de/index.php?id=76
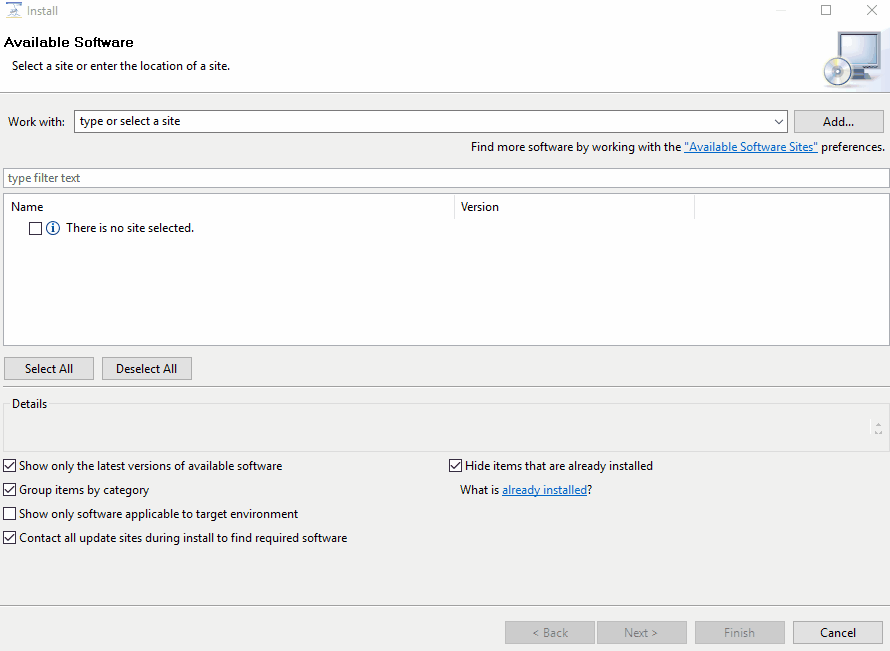
When you have downloaded Odysseus, you need to add a few plugins to your installation. Use "Help" → "Install New Software". Choose the predefined update URL and install every package for the following keywords: "spatial", "keyvalue" and "nmea".
Accessing Example Data
For this example, we use vessel AIS data from the San Francisco bay, which is provided by ais.exploratorium.edu (you can open this in a browser and see the raw AIS data). You use this query to access the data. Just create a new Odysseus Script file within Odysseus Studio and run this query (with the "green arrow down"-button). The query does access the raw AIS data, converts it into key-value objects, filters some data, converts it to a tuple and finally uses latitude and longitude data to create an geo-object. The latter can be used by Odysseus for spatial functionality. If you want to see the data, do the following: after running the query, you should see "System.SanFranciscoAIS" in the Sources-view. Right click and choose "Query source" to view the data.
...
| Code Block |
|---|
12|UnderwayUsingEngine|NotAvailable|223|false|218.2|12.9|374128000|20|false|POINT (37.751635 -122.68389166666667)|{"374128000":[{"trajectoryElement":{"movingObjectID":"374128000","geoHash":{"bits":5589500436528045806,"point":{"longitude":-122.68389166666667,"latitude":37.751635},"boundingBox":{"minLat":37.75163498707116,"maxLat":37.75163502898067,"minLon":-122.68389173783362,"maxLon":-122.68389165401459},"significantBits":64},"distanceToPreviousElement":66.39223462250055,"streamElement":{}},"meters":0.0},{"trajectoryElement":{"movingObjectID":"374128000","geoHash":{"bits":5589500440284126512,"point":{"longitude":-122.682585,"latitude":37.75300333333333},"boundingBox":{"minLat":37.75300333276391,"maxLat":37.753003374673426,"minLon":-122.68258508294821,"maxLon":-122.68258499912918},"significantBits":64},"distanceToPreviousElement":64.17029786044263,"streamElement":{}},"meters":190.5932328122322},{"trajectoryElement":{"movingObjectID":"374128000","geoHash":{"bits":5589500441130161997,"point":{"longitude":-122.68214666666667,"latitude":37.753465},"boundingBox":{"minLat":37.75346496608108,"maxLat":37.7534650079906,"minLon":-122.68214670941234,"maxLon":-122.6821466255933},"significantBits":64},"distanceToPreviousElement":63.10852580037621,"streamElement":{}},"meters":254.76334501265032},{"trajectoryElement":{"movingObjectID":"374128000","geoHash":{"bits":5589500439526094378,"point":{"longitude":-122.68342833333334,"latitude":37.75210666666667},"boundingBox":{"minLat":37.75210663676262,"maxLat":37.752106678672135,"minLon":-122.6834283862263,"maxLon":-122.68342830240726},"significantBits":64},"distanceToPreviousElement":59.35999960990177,"streamElement":{}},"meters":66.39223462250055},{"trajectoryElement":{"movingObjectID":"374128000","geoHash":{"bits":5589500439809071195,"point":{"longitude":-122.683025,"latitude":37.752535},"boundingBox":{"minLat":37.7525349939242,"maxLat":37.752535035833716,"minLon":-122.68302504904568,"maxLon":-122.68302496522665},"significantBits":64},"distanceToPreviousElement":64.85054572839009,"streamElement":{}},"meters":125.74570287102185}]} | META | 1488546619406|oo |
Show data on a map
Attention: This step is not available for now when you use the pre-compiled Odysseus version. You can checkout Odysseus via GIT and use this feature that way.
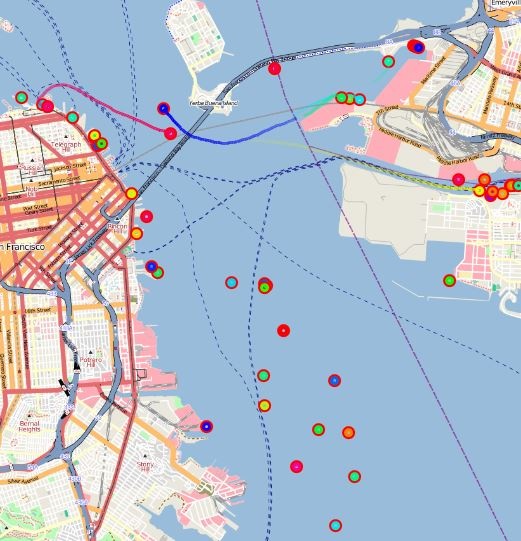
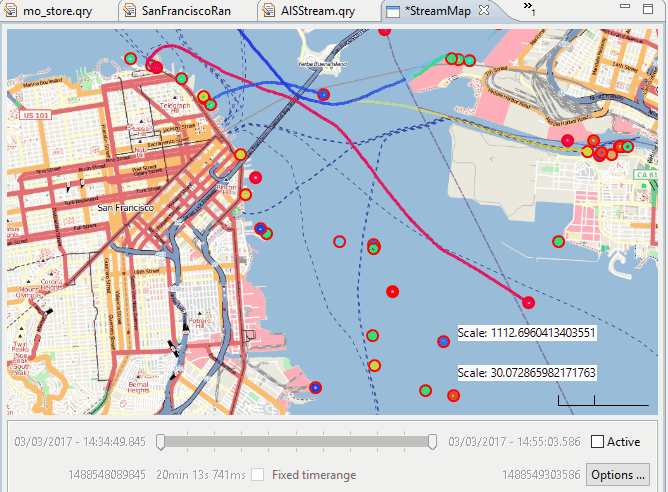
You can visualize the vessels with their trajectories on a map.
...
Now, the vessels are simpler to see, especially if they are currently not moving.
Usage of the time slider
With the time slider you can choose the time range that you want to visualize.
Future Work
The work on this topic is not finished. Here list of things that we want to add in future releases.
...