Odysseus has built-in features in the spatial package with which spatio-temporal and especially moving objects data can be processed. Here we describe how to use these features and give a few example scenarios.
Starting Odysseus Spatial
Accessing Example Data
For this example, we use vessel AIS data from the San Francisco bay, which is provided by ais.exploratorium.edu (you can open this in a browser and see the raw AIS data). You use this query to access the data. Just create a new Odysseus Script file within Odysseus Studio and run this query (with the "green arrow down"-button). The query does access the raw AIS data, converts it into key-value objects, filters some data, converts it to a tuple and finally uses latitude and longitude data to create an geo-object. The latter can be used by Odysseus for spatial functionality. If you want to see the data, do the following: after running the query, you should see "System.SanFranciscoAIS" in the Sources-view. Right click and choose "Query source" to view the data.
#PARSER PQL
#RUNQUERY

/// Access the data from San Francisco
input = ACCESS({
            source='SanFranciscoAIS',
            wrapper='GenericPush',
            transport='TCPClient',
            protocol='NMEA',
            datahandler='keyValueObject',
            options=[
              ['host', 'ais.exploratorium.edu'],
              ['port', '80']
            ]
          }
        )

/// Filter the AIS messages to those from vessels
vesselsOnly = SELECT({
                  predicate = 'isNull(rateOfTurn) = false'
                },
                input
              )

/// Convert the key-value object to a tuple
tuple = TOTUPLE({
            schema = [
              ['rateOfTurn','Integer'],
              ['navigationStatus','String'],
              ['maneuverIndicator','String'],
              ['trueHeading','Integer'],
              ['positionAccurate','Boolean'],
              ['latitude','Double'],
              ['courseOverGround','Double'],
              ['speedOverGround','Double'],
              ['sourceMmsi','Integer'],
              ['longitude','Double'],
              ['second','Integer'],
              ['raimFlag','Boolean']
            ]
          },
          vesselsOnly
        )

/// Create a geoObject from lat/lng
SanFranciscoAIS := MAP({
                        expressions = [
                          ['FromWKT("POINT (" + toString(latitude) + " " + toString(longitude) + ") ")', 'SpatialPoint']
                        ],
                        keepinput = true,
                        removeattributes = ['latitude','longitude'],
                        name = 'geo_object'
                      },
                      tuple
                    )
A message you receive could look similar to the following:
{"rateOfTurn":0,"navigationStatus":"UnderwayUsingEngine","maneuverIndicator":"NotAvailable","trueHeading":274,"positionAccurate":false,"latitude":37.56334666666667,"courseOverGround":272.3,"speedOverGround":13.4,"sourceMmsi":367134000,"longitude":-123.107605,"second":18,"raimFlag":false};1488537437230|oo
Filling a Spatio-Temporal Index
This data can now be used to fill a spatio-temporal index for moving objects. To do this, create another Odysseus Script file and run the following query.
#PARSER PQL

/// The index structure
#DEFINE dataStructureName 'sanFranciscoStore'
#DEFINE dataStructureType 'mo_geohash'

#RUNQUERY


/// Store the data in an index structure
movingObjectIndex = MOVINGOBJECTSTORE({
                        /// distance of the trajectory in meters that we keep for every moving object
						distancepermo = 100.0,
                        geometryattribute = 'SpatialPoint',
                        datastructurename = ${dataStructureName},
                        idattribute = 'sourceMmsi',
                        datastructuretype = ${dataStructureType}
                      },
                      System.SanFranciscoAIS
                    )
Running a Range-Query on the Index
Now we can use this index to run a continuous range query for the vessels. We could reduce the number of vessels where we do the range query for by using another "Select"-operator. Nevertheless, here we calculate the range for every incoming object. The result of the query is within the "neighbors"-field of the tuple and as for now contains a JSON-object.
#PARSER PQL
#DEFINE dataStructureName 'sanFranciscoStore'
#ADDQUERY

/// For every vessel we want to know which vessels are near them all the time
range = MOVINGOBJECTRANGE({
            geometryattribute = 'SpatialPoint',
            datastructurename = ${dataStructureName},
            range = 300
          },
          System.SanFranciscoAIS
        )
A result could look like this:
12|UnderwayUsingEngine|NotAvailable|223|false|218.2|12.9|374128000|20|false|POINT (37.751635 -122.68389166666667)|{"374128000":[{"trajectoryElement":{"movingObjectID":"374128000","geoHash":{"bits":5589500436528045806,"point":{"longitude":-122.68389166666667,"latitude":37.751635},"boundingBox":{"minLat":37.75163498707116,"maxLat":37.75163502898067,"minLon":-122.68389173783362,"maxLon":-122.68389165401459},"significantBits":64},"distanceToPreviousElement":66.39223462250055,"streamElement":{}},"meters":0.0},{"trajectoryElement":{"movingObjectID":"374128000","geoHash":{"bits":5589500440284126512,"point":{"longitude":-122.682585,"latitude":37.75300333333333},"boundingBox":{"minLat":37.75300333276391,"maxLat":37.753003374673426,"minLon":-122.68258508294821,"maxLon":-122.68258499912918},"significantBits":64},"distanceToPreviousElement":64.17029786044263,"streamElement":{}},"meters":190.5932328122322},{"trajectoryElement":{"movingObjectID":"374128000","geoHash":{"bits":5589500441130161997,"point":{"longitude":-122.68214666666667,"latitude":37.753465},"boundingBox":{"minLat":37.75346496608108,"maxLat":37.7534650079906,"minLon":-122.68214670941234,"maxLon":-122.6821466255933},"significantBits":64},"distanceToPreviousElement":63.10852580037621,"streamElement":{}},"meters":254.76334501265032},{"trajectoryElement":{"movingObjectID":"374128000","geoHash":{"bits":5589500439526094378,"point":{"longitude":-122.68342833333334,"latitude":37.75210666666667},"boundingBox":{"minLat":37.75210663676262,"maxLat":37.752106678672135,"minLon":-122.6834283862263,"maxLon":-122.68342830240726},"significantBits":64},"distanceToPreviousElement":59.35999960990177,"streamElement":{}},"meters":66.39223462250055},{"trajectoryElement":{"movingObjectID":"374128000","geoHash":{"bits":5589500439809071195,"point":{"longitude":-122.683025,"latitude":37.752535},"boundingBox":{"minLat":37.7525349939242,"maxLat":37.752535035833716,"minLon":-122.68302504904568,"maxLon":-122.68302496522665},"significantBits":64},"distanceToPreviousElement":64.85054572839009,"streamElement":{}},"meters":125.74570287102185}]} | META | 1488546619406|oo
Show data on a map
You can visualize the vessels with their trajectories on a map.
Adding a simple stream with location data
To do this, we first need a simple data stream from our vessels. Therefore, we can use this simple query:
#PARSER PQL
#RUNQUERY

/// For the map view
out = TIMEWINDOW({
          size = [60, 'MINUTES']
        },
        System.SanFranciscoAIS
      )
Add a new map
Next, we create a map. Right click on your project / folder in the Project Explorer and choose "New" → "Other ..." → "Odysseus Map". When you created the map, you should see an empty grid. Next, we will add a background map from a tile server. We have a few predefined tile-servers you can use. You should see "Map Layers" and "Map Connections" on the right as you can see in the figure below. If you don't see these, you can add them via "Window" → "Show View" → "Other" and then select them.
![]()
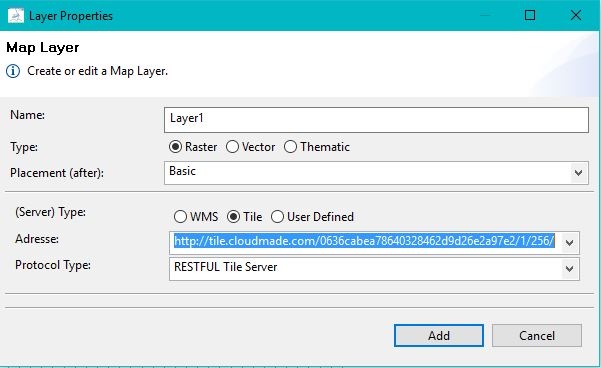
Add a tile server
On the layers view, we click "Add" and choose the "http://tile.cloudmade.com/0636cabea78640328462d9d26e2a97e2/1/256/" tile server.
Now we should be able to see a world map. You can now zoom in to San Francisco where the vessels will appear after the next step.
Add the map connection
Change to the "Map Connections"-view. You should already have started the query from above. When you now click on "Connect", a window appears in which you ca select the query ("out = TIMEWINDOW ..."). Select this query and click "OK". The query should now appear in the "Map Connections" view.
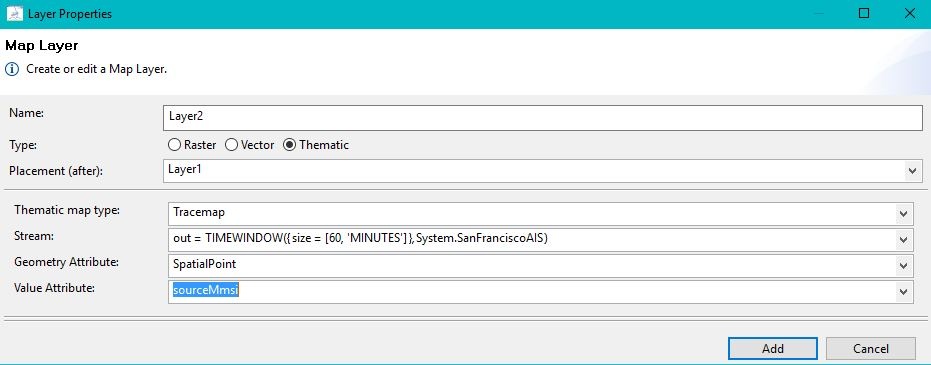
Add a new layer
Switch back so the "Map Layers"-view. Click on "Add" to add a new layer. Choose "Thematic", Placement after Layer1 (the tile layer), choose the thematic map type as "Tracemap". The stream should be selected correct (with the map connection from the previous step). The GeometryAttribute is "SpatialPoint" and "Value Attriute" is the unique id of the vessels: "sourceMmsi". Now you can click "Add".
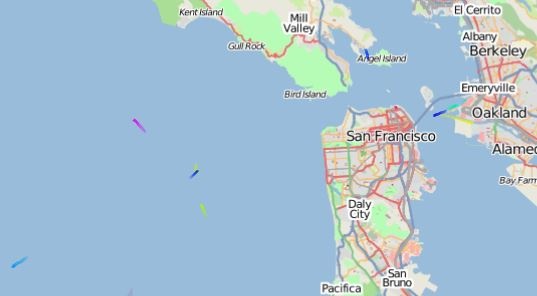
Configuring the Tracemap
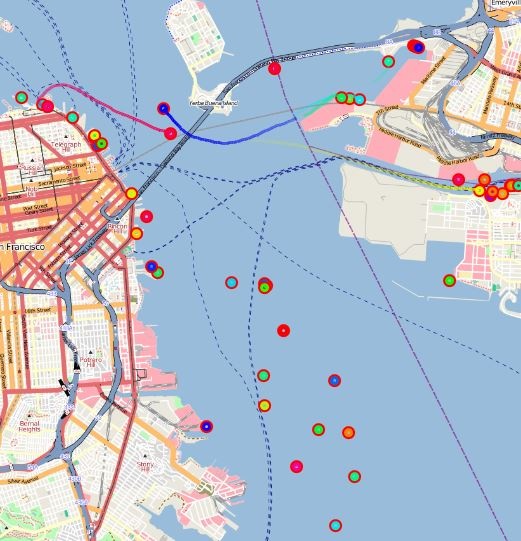
A few seconds later you should be able to see the vessels moving on the map.
This map can be configured. Right click on "Layer2" and choose "Map properties". To better see the vessels, you can, for example, choose "Mark end of traces" or change the colors and length of the traces.
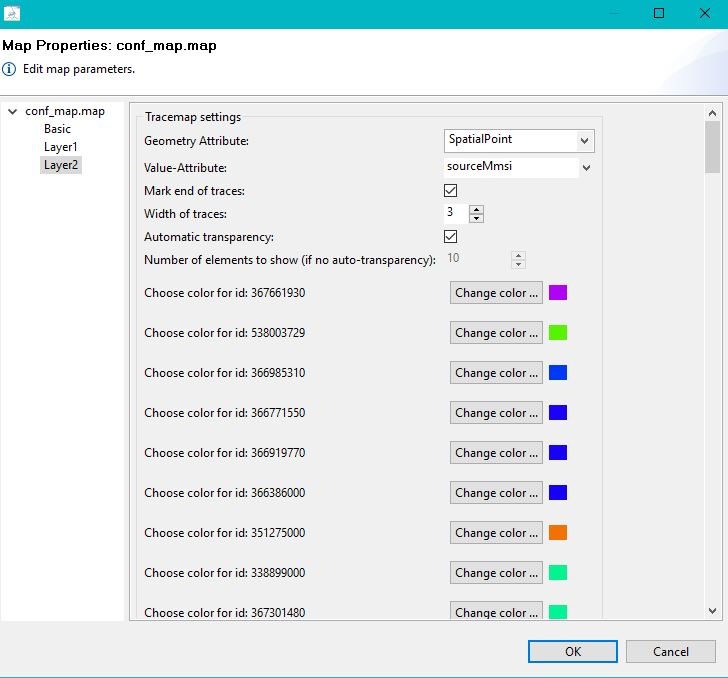
Now, the vessels are simpler to see, especially if they are currently not moving.
Usage of the time slider
Future Work
The work on this topic is not finished. Here list of things that we want to add in future releases.
- Providing a web-based map view to visualize the queries, e.g. with Spring Boot + Leaflet (or OpenLayers). Can be a bit inspired by the demonstration visualization by Tile38 (e.g. http://tile38.com/ or https://roam.sh/)
- Adding interpolation functionality to calculate in-between-measurements locations and near-future locations