In this tutorial you will learn how to write aggregation queries and learn about the window concept in Odysseus.
We will use the same setting as in Simple Query Processing. So you should follow steps 1-4.
Odysseus provides a wide range of aggregation operators. In this tutorial we will focus on the typical aggreations average (AVG), count (COUNT), sum (SUM), minimum (MIN) and maximum (MAX).
Crate a new Odysseus Script file with the PQL template an name it aggregation1. Change #RUNQUERY to #ADDQUERY. By this, the query will only be installed an not started, so its easier to see what happens.
Write the following query:
#PARSER PQL
#TRANSCFG Standard
#ADDQUERY
out = AGGREGATE({
          aggregations=[['COUNT', 'price', 'COUNT_price', 'integer']]
        },
        nexmark:bid
) |
Here you can see the aggreation operator that connects to source nexmark:bid. The aggregate functions are defined by the aggregations parameter. In this example you can see four entries. The first entry defines the aggreagte function, COUNT in this case. The second entry, the attribute can should be used for the aggregation. For COUNT is does not matter, which attribute of the input element should be treated, but one attribute must be given, so be choose price. The third parameter defines the name of the output attribute, i.e. what is the new name for the output and finally, the last parameter determines the output data type. This parameter is optional.
Now execute the script, and show the result stream (e.g. as a table). Now start the query (e.g. with the selection of the Start Query Button).
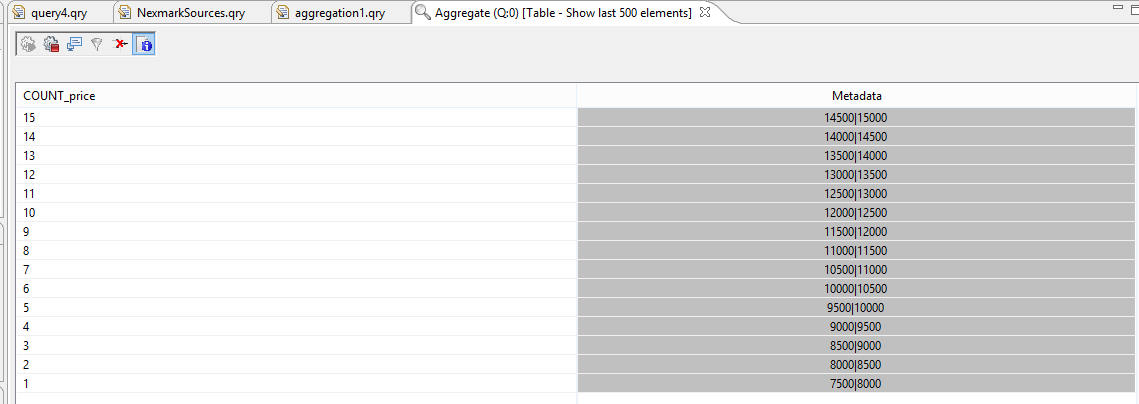
The result should be something like this:

Here you can see 15 bids that have entered the system.
Other aggregations can be added easily, by adding another value to the aggregations parameter.
In the Project Exploer
Replace the input with the following:
#PARSER PQL
#TRANSCFG Standard
#ADDQUERY
out = AGGREGATE({
          aggregations=[
            ['COUNT', 'price', 'COUNT_price', 'integer'],
            ['AVG', 'price', 'AVG_price'],
            ['SUM', 'price', 'SUM_price'],
            ['MIN', 'price', 'MIN_price'],
            ['MAX', 'price', 'MAX_price']
          ]
        },
        nexmark:bid
) |
The results of the query should look somehow like the following:

Now its time to highlight the Metadata part a little more.
In the last column you can see two values, separated by "|". The two values show the validity of the event. 7500|8000 e.g. means, that this event was valid in real time starting at 7500 (in Nexmark this means after 7.5 seconds) and ends before 8000, mathematical this is a right open interval: [7500,8000).
If you look at the values, you can see that they are not overlapping. This should be rather clear, because the count e.g. can not be 1 and 2 at the same time. The metadata show, that every 500 (in this case milliseconds) a new bid is send to the system and a new aggregation is build.