
The Odysseus WebStudio is another way to interact with an Odysseus server. See WebStudio for further information.
Here, we will show a simple, docker-based introduction to a self hosted WebStudio. To follow this tutorial you will need to have docker installed. This could be done with Docker Desktop for Windows or MacOS or with an installation on Linux.
To get a quick startup, it is advisable to use the following docker compose file with
services:
  frontend:
    image: odysseusol/webstudio_frontend:latest
    ports:
      - "4200:80"
    environment:
      NODE_ENV: production
    restart: always
    depends_on:
      - backend

  backend:
    image: odysseusol/webstudio_backend:latest
    ports:
      - "3000:3000"
    environment:
      NODE_ENV: production
      MONGODB_URI: mongodb://database:27017/webstudio
      SECRET_TOKEN: jwtSecretToken
      DOWNLOAD_TOKEN: downloadToken
      PROJECTS_FOLDER: projects
      ACCESS_TOKEN_LIFESPAN: 43200
    restart: always
    depends_on:
      - database
    volumes:
      - backenddata:/home/node/app/projects
      - ./backend/logs:/home/node/app/logs

  database:
    image: mongo
    restart: always
    ports:
      - "27017:27017"
    volumes:
      - mongodbdata:/data/db

  nexmark:
    image: odysseusol/nexmark
    restart: always
    ports:
      - 65440-65443:65440-65443

  standalone01:
    image: odysseusol/odysseus
    stdin_open: true
    restart: always
    ports:
        - 18888:8888
    volumes:
       - ./standalone01:/var/lib/odysseus

volumes:
  mongodbdata:
  backenddata:
|
Just copy this file to some location on your local disk and run
docker compose up -d |
After this, you should see something like this:

Now you can use your browser and open http://localhost:4200/ (change, if you run the docker compose on another server, in the following we assume, that you will use localhost)
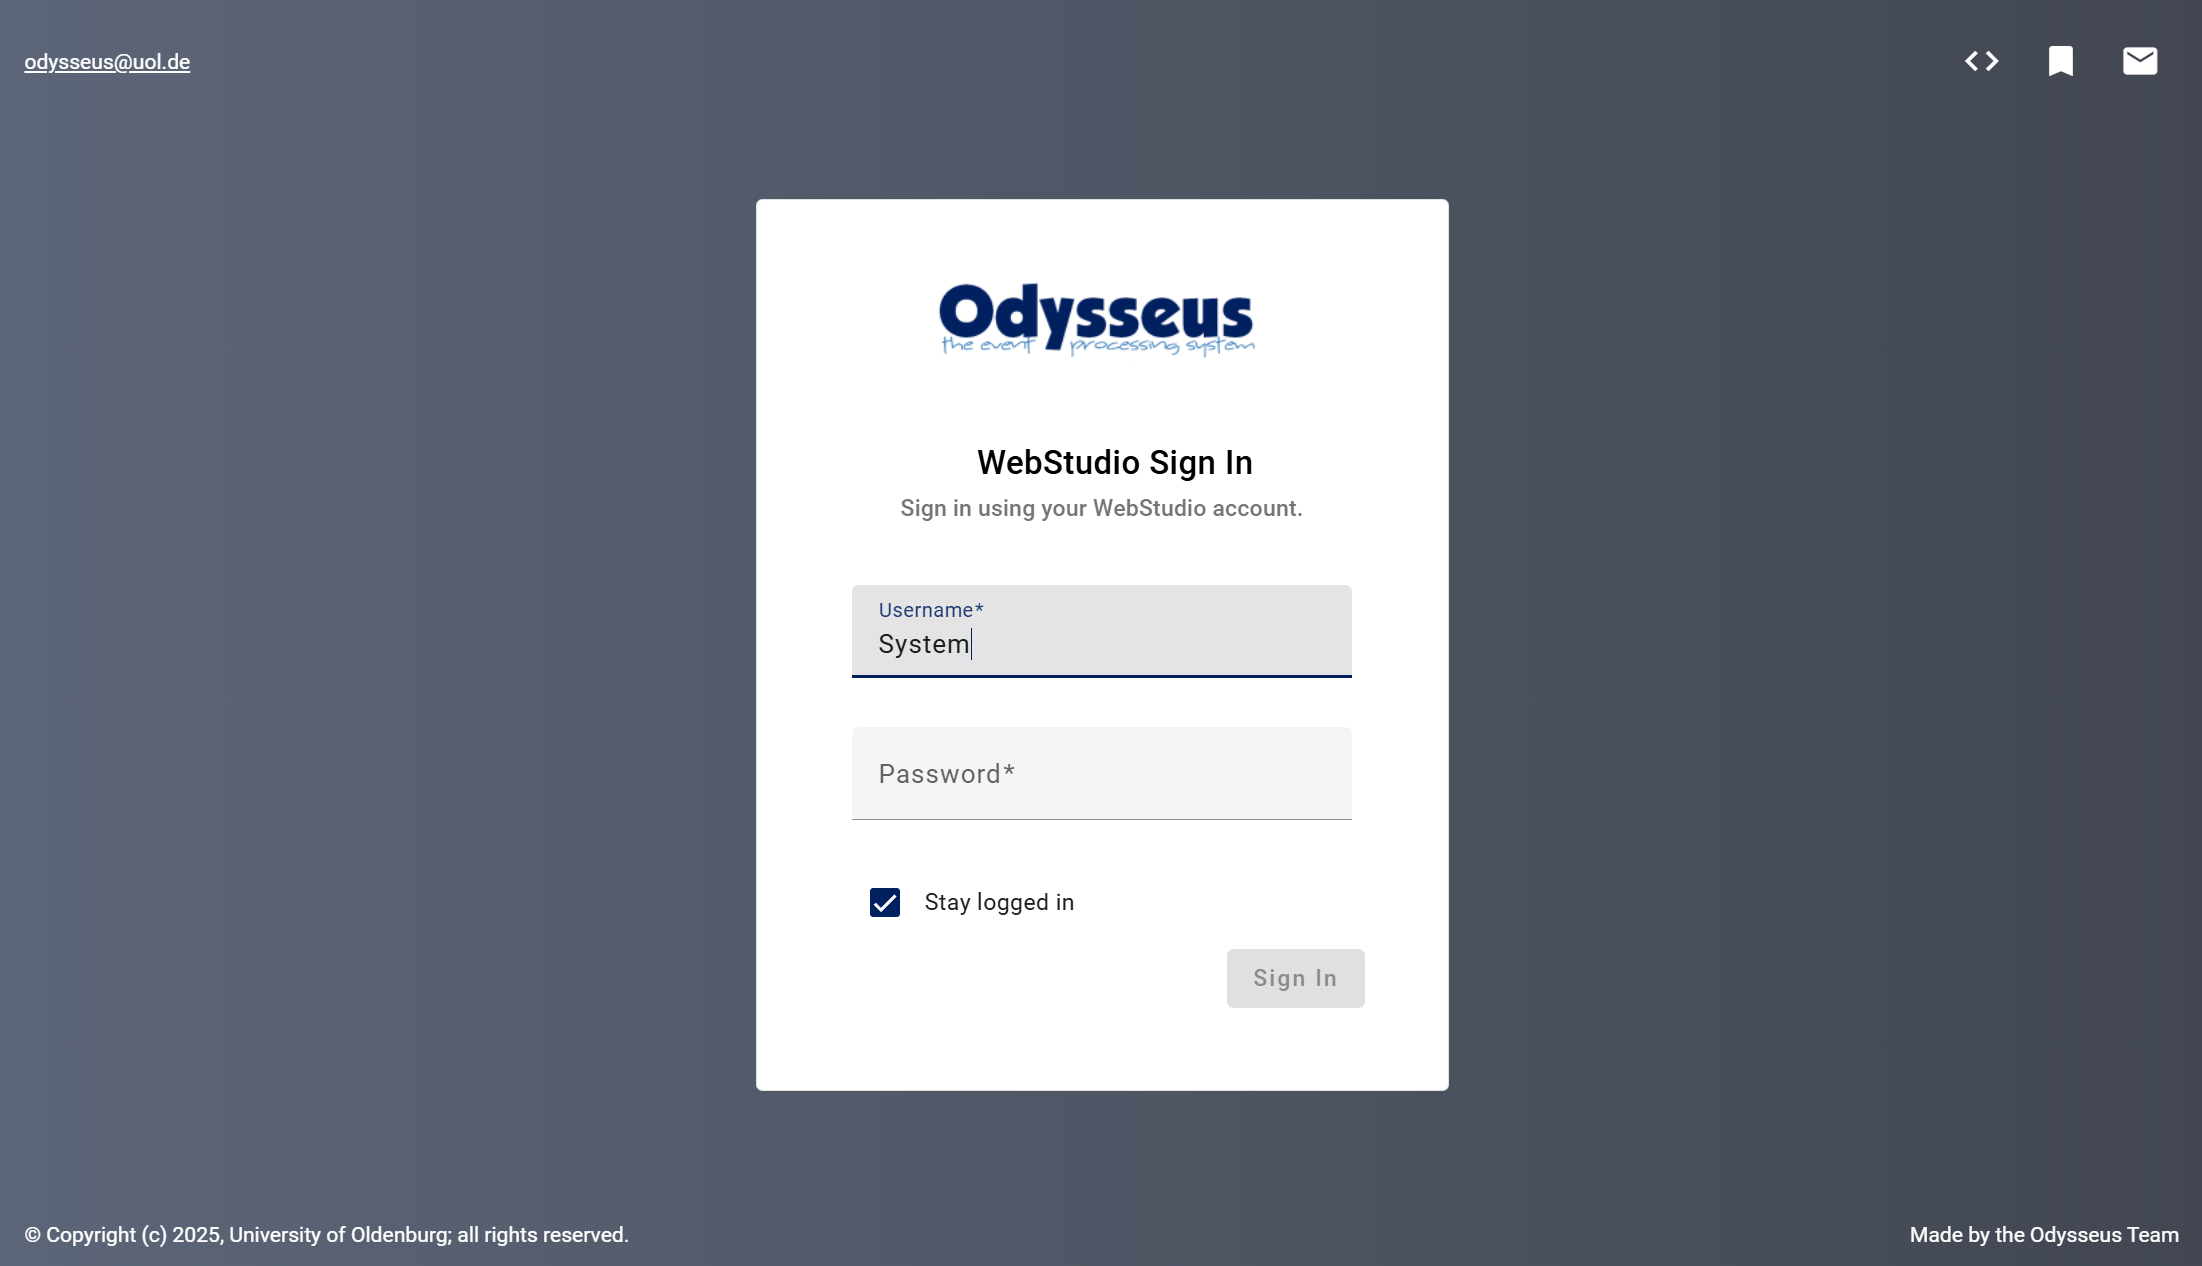
Here you can add the credential that are per default: "System" and "manager"
On the left side, there is the menu bar, that can be extended by clicking on the burger menu.

When you want to change the password for the System user or create new users, you could use the "Users" entry.
As WebStudio can be used to connect to different Odysseus servers at the same time, the first step is to add new servers under the "Connection" entry.
You could use any Odysseus server, but in this tutorial we will use the server, that is delivered with the docker compose file.
In the Connections menu klick on 
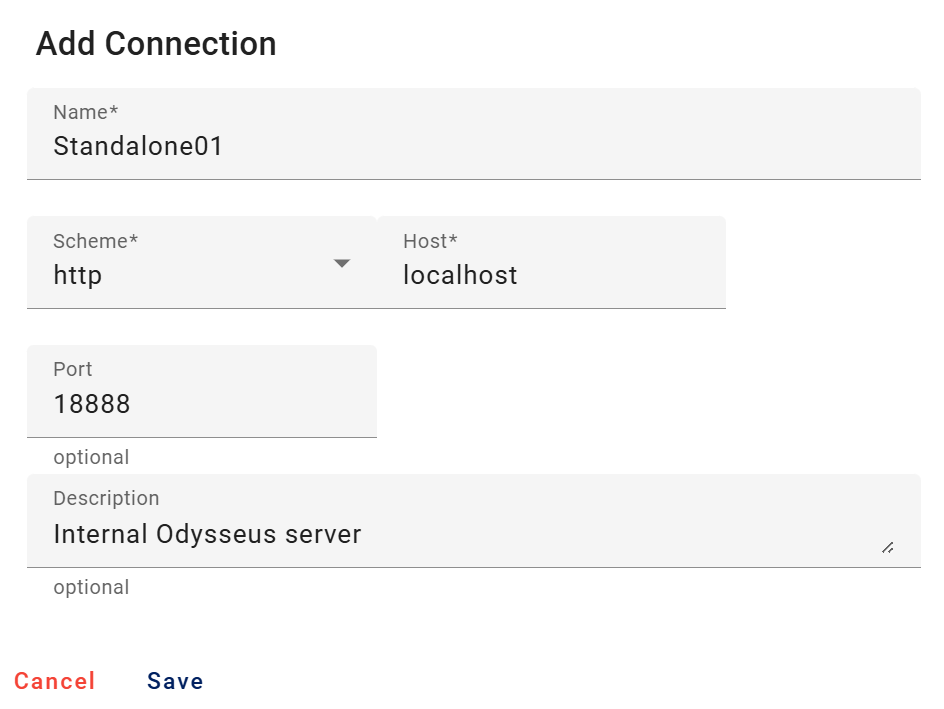
See the docker compose file for the port. If you change the port or add additional servers, you will need to choose this port.
   standalone01:
    image: odysseusol/odysseus
    stdin_open: true
    restart: always
    ports:
        - 18888:8888
    volumes:
- ./standalone01:/var/lib/odysseus |
Afterwards you should see something like

Now, it is important to log into the server (at the moment it is only connected). For this, click on the ![]() button and fill out the login credentials
button and fill out the login credentials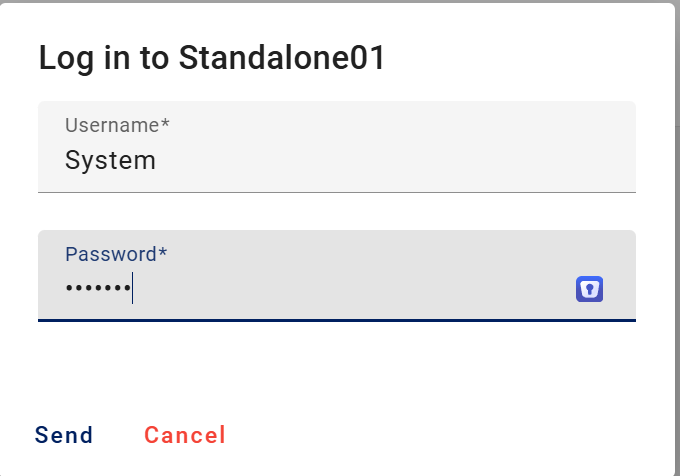
if you didn't change anything, this is again System and manager.
Afterwards you will see the following:

You can use![]() to log out again from this server.
to log out again from this server.
 can be used to edit or delete the connection.
With ![]() you get to the IDE for this server.
you get to the IDE for this server.
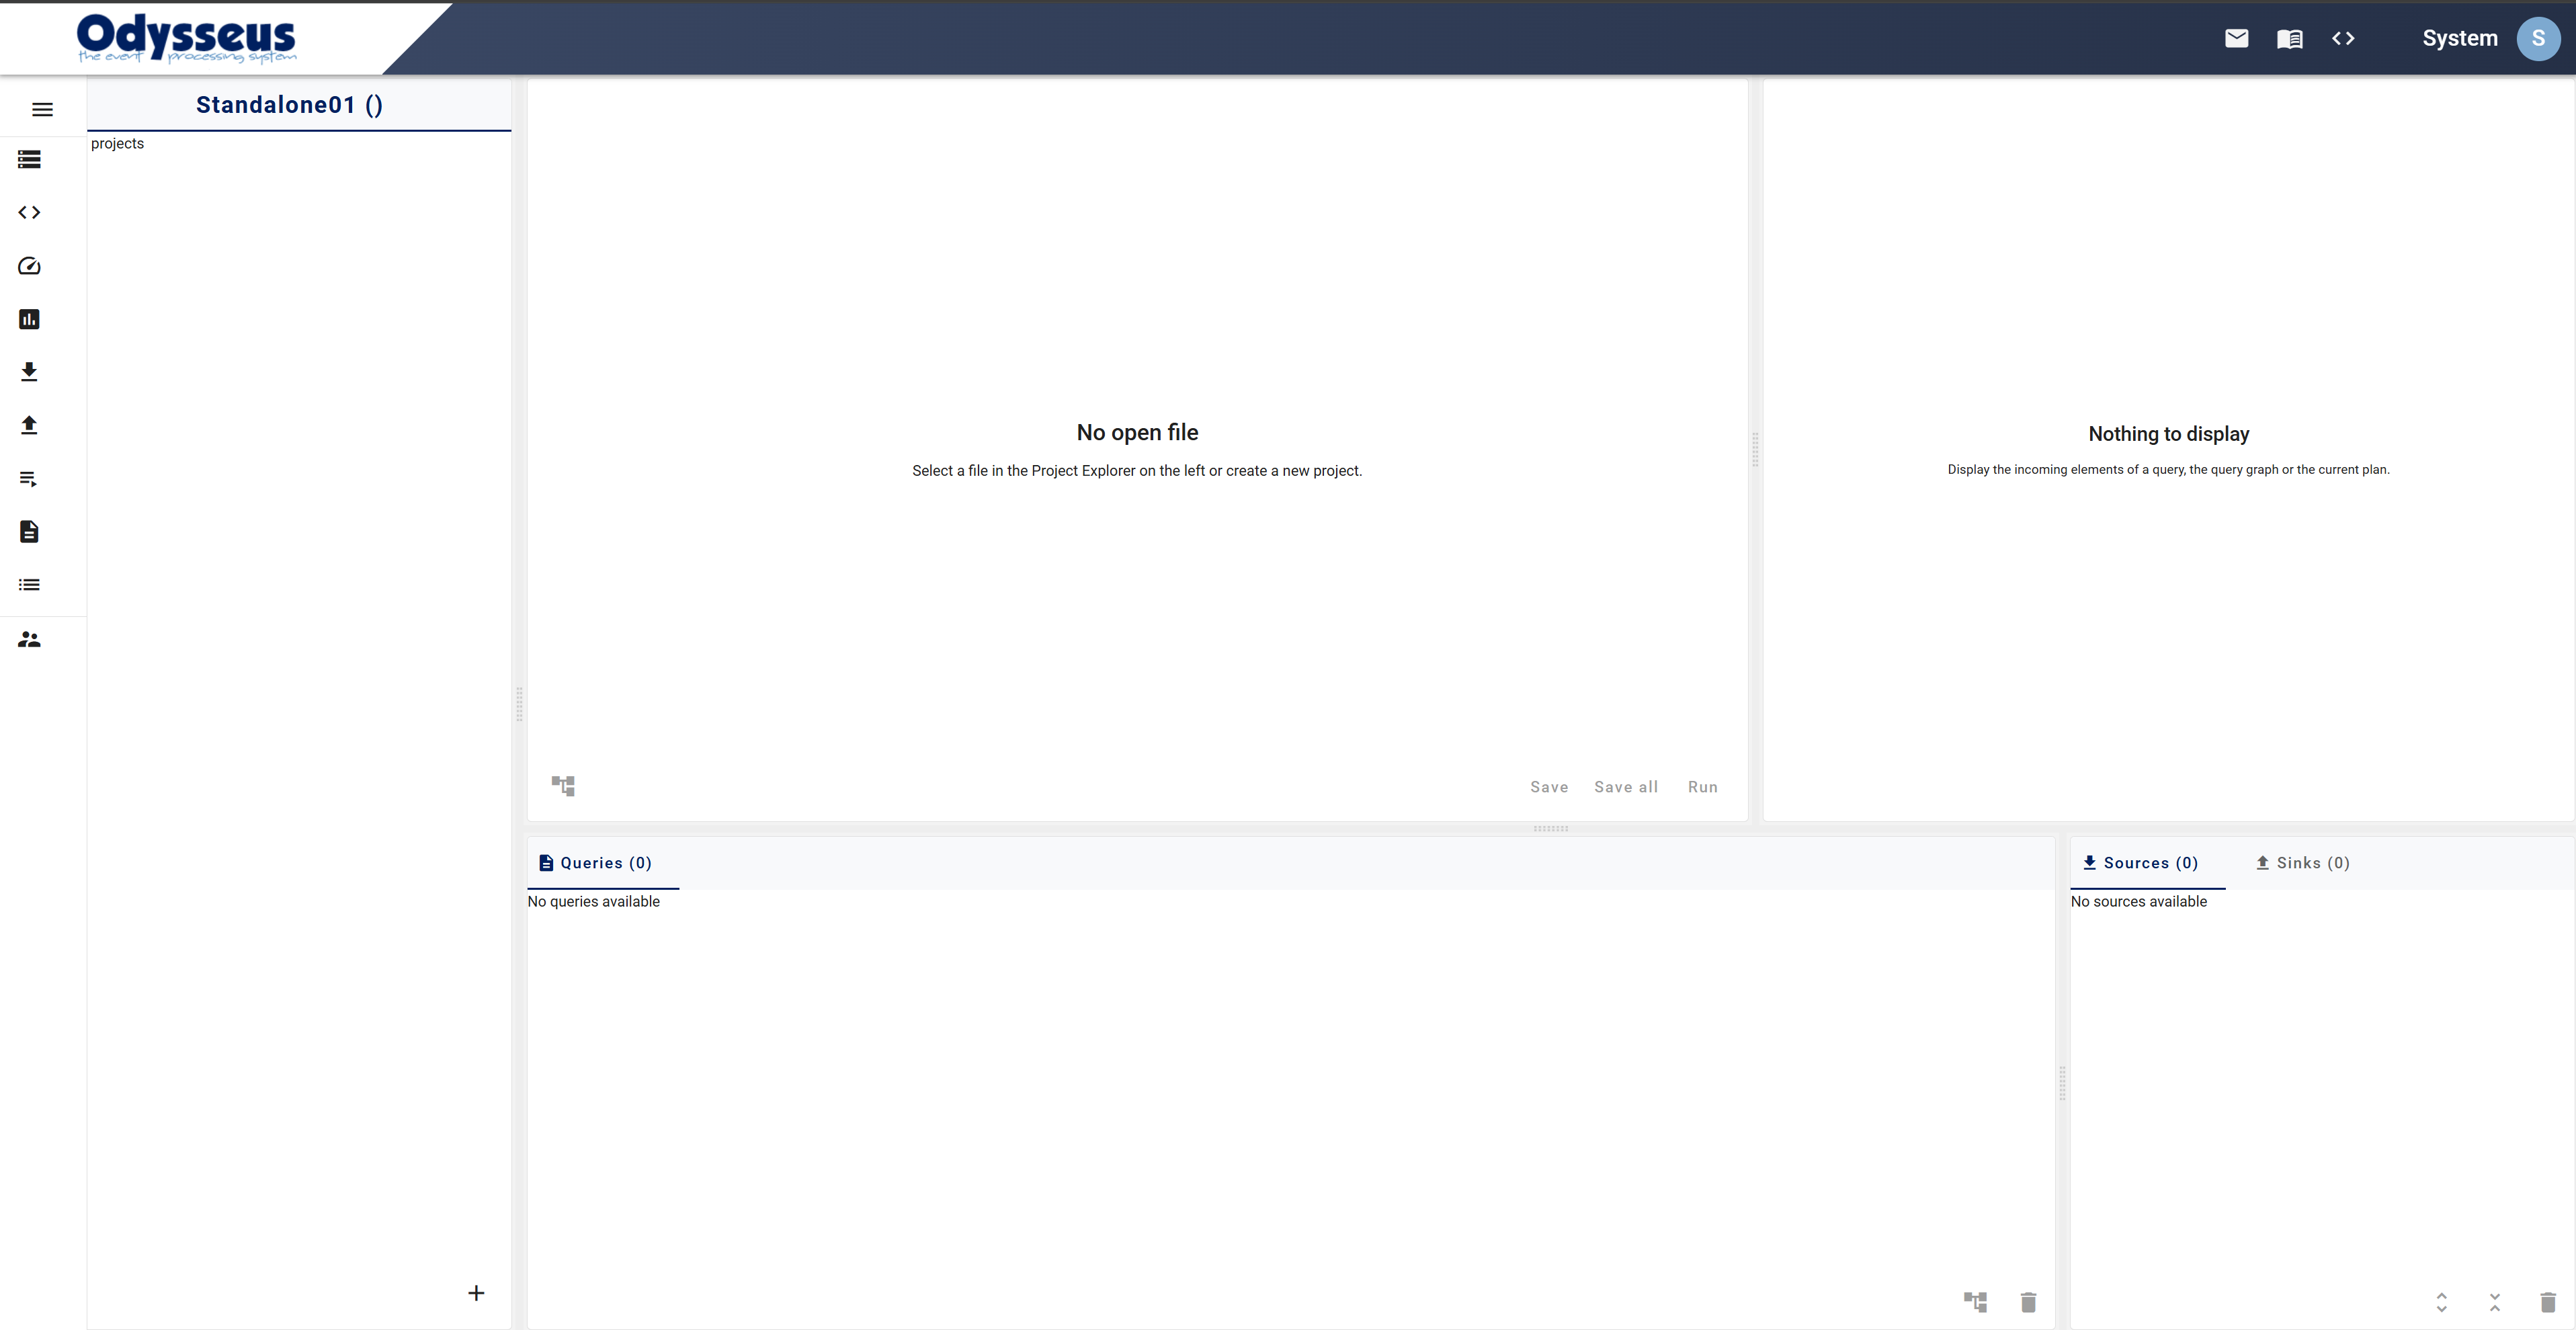
The first step now, is to create a new project with the  on the left lower side.
Name the project e.g. Nexmark
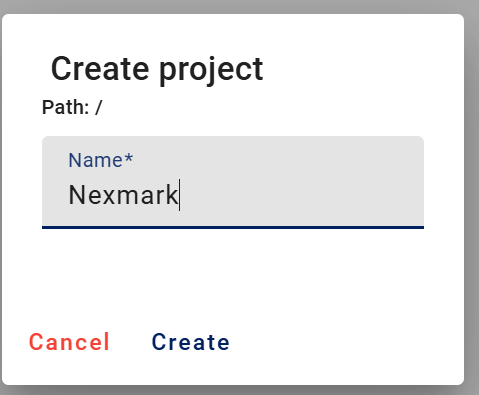
You will see
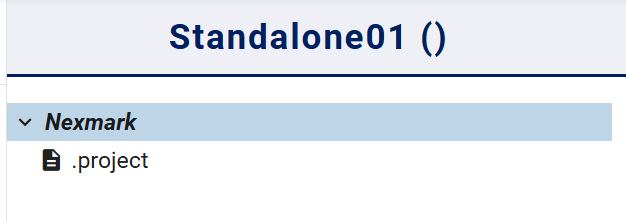
Now click on the "New File in current directory"
Name the file nexmark.qry
Now copy and paste the following script.
Remark: Because nexmark and this Odysseus instance are inside a docker environment you cannot use localhost for nexmark queries → use "nexmark" instead.
#PARSER PQL
#RUNQUERY
nexmark:person := ACCESS({source='nexmark:person',
    wrapper='GenericPush',
    transport='TCPClient',
    protocol='SizeByteBuffer',
    dataHandler='Tuple',
    options=[
        ['host', 'nexmark'],
        ['port', '65440'],
        ['ByteOrder', 'LittleEndian']
        ],
    schema=[
        ['timestamp', 'STARTTIMESTAMP'],
        ['id', 'INTEGER'],
        ['name', 'STRING'],
        ['email', 'STRING'],
        ['creditcard', 'STRING'],
        ['city', 'STRING'],
        ['state', 'STRING']
        ]
    })

#RUNQUERY
nexmark:bid := ACCESS({source='nexmark:bid',
    wrapper='GenericPush',
    transport='TCPClient',
    protocol='SizeByteBuffer',
    dataHandler='Tuple',
    options=[
        ['host', 'nexmark'],
        ['port', '65442'],
        ['ByteOrder', 'LittleEndian']
        ],
    schema=[
        ['nexmark:bid','timestamp', 'STARTTIMESTAMP'],
        ['nexmark:bid','auction', 'INTEGER'],
        ['nexmark:bid','bidder', 'INTEGER'],
        ['nexmark:bid','datetime', 'LONG'],
        ['nexmark:bid','price', 'DOUBLE']
        ]
    })

#RUNQUERY
nexmark:auction := ACCESS({source='nexmark:auction',
    wrapper='GenericPush',
    transport='TCPClient',
    protocol='SizeByteBuffer',
    dataHandler='Tuple',
    options=[
        ['host', 'nexmark'],
        ['port', '65441'],
        ['ByteOrder', 'LittleEndian']
        ],
    schema=[
        ['timestamp', 'STARTTIMESTAMP'],
        ['id', 'INTEGER'],
        ['itemname', 'STRING'],
        ['description', 'STRING'],
        ['initialbid', 'INTEGER'],
        ['reserve', 'INTEGER'],
        ['expires', 'LONG'],
        ['seller', 'INTEGER'],
        ['category', 'INTEGER']
        ]
    })

#RUNQUERY
nexmark:category := ACCESS({source='nexmark:category',
    wrapper='GenericPush',
    transport='TCPClient',
    protocol='SizeByteBuffer',
    dataHandler='Tuple',
    options=[
        ['host', 'nexmark'],
        ['port', '65443'],
        ['ByteOrder', 'LittleEndian']
        ],
    schema=[
        ['id', 'INTEGER'],
        ['name', 'STRING'],
        ['description', 'STRING'],
        ['parentid', 'INTEGER']
        ]
}) |
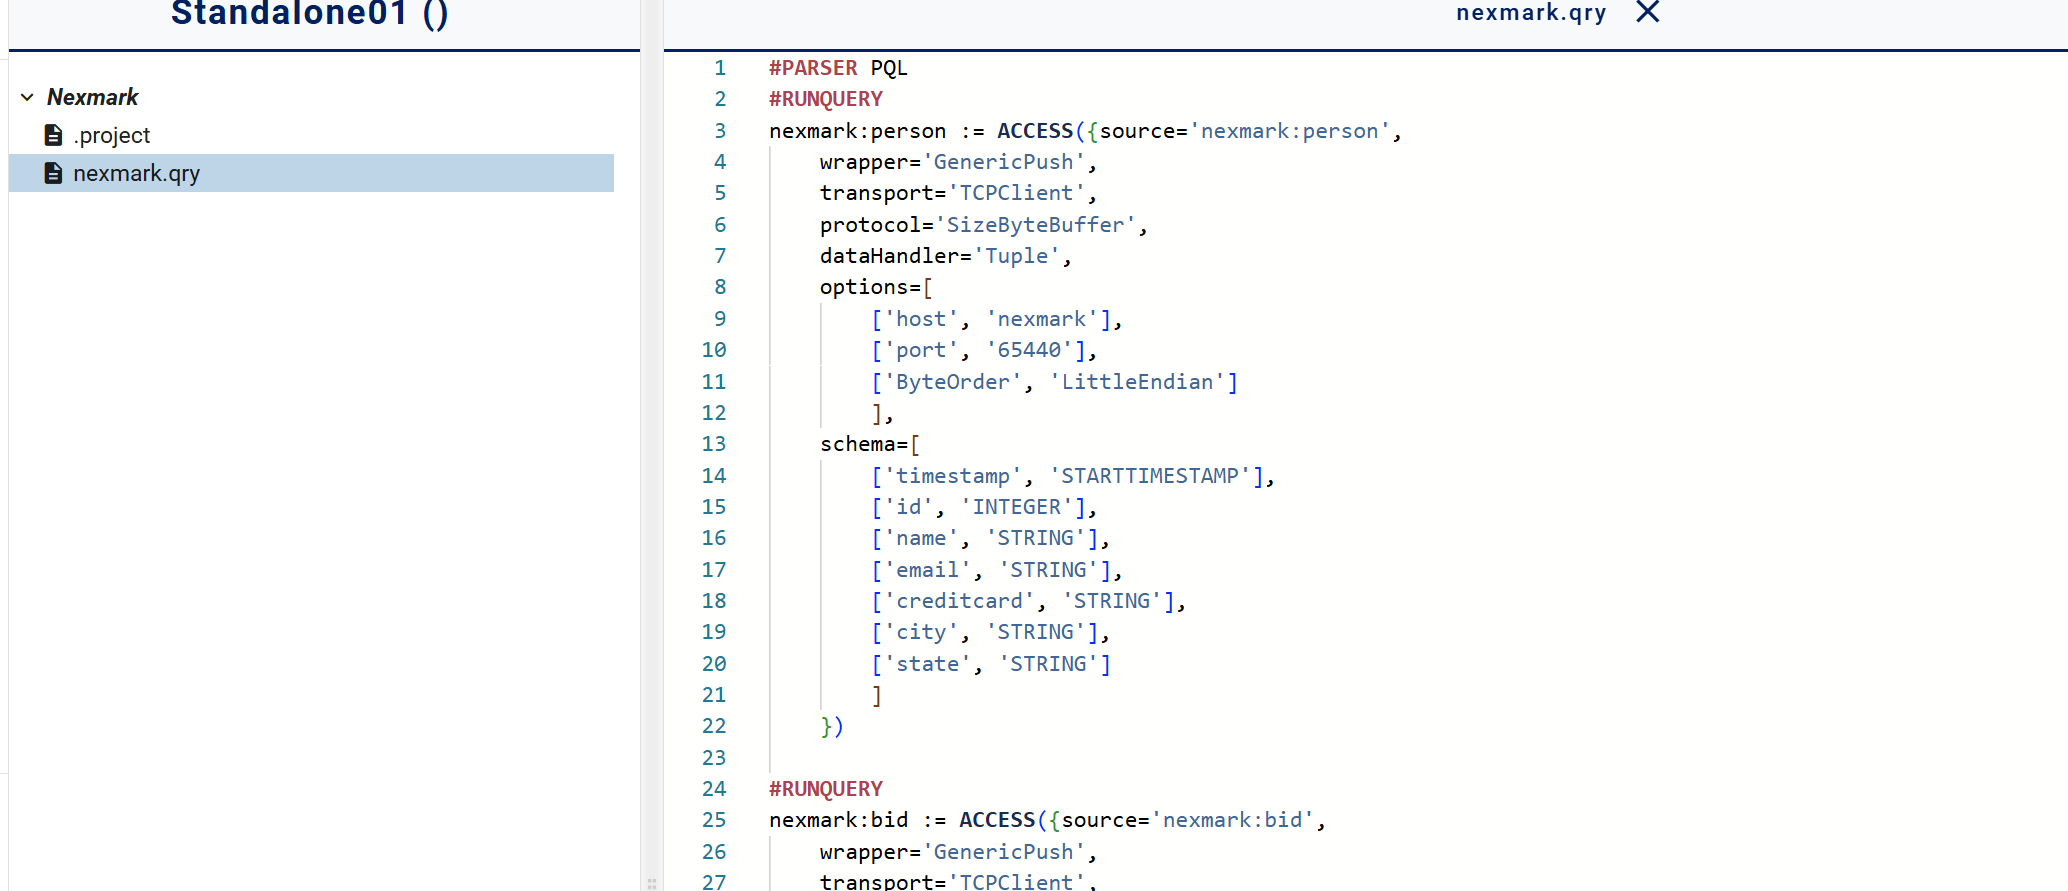
And klick on "Run" in the lower right corner of the editor pane.

In the lower right corner, you should see the following:
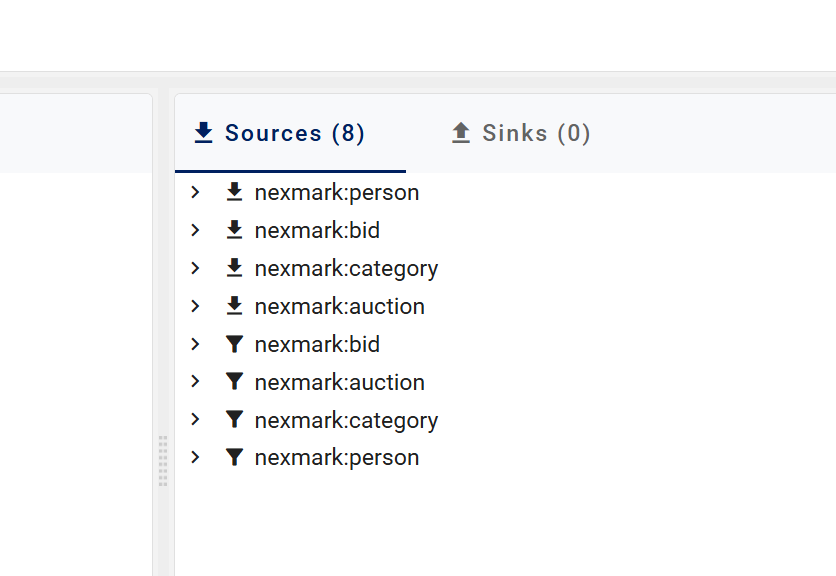
If there are errors, they are not (yet) shown in this view. You will ne to navigate to 
And you will see error messages.
Here everything went fine:

Now you can create another query, e.g. filtering all bids with a price higher than 200.
For this, you could use PQL (same as the source definition)

and press Run.
In the Queries windows you will see this query:

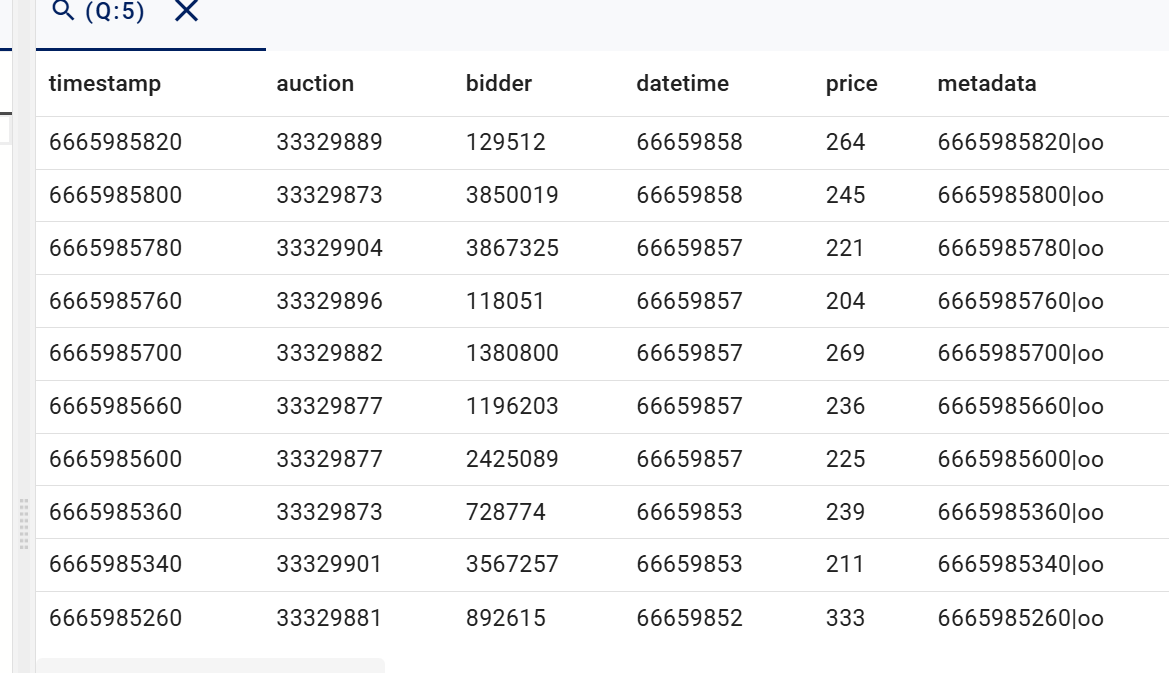
To see results, right click on the line and select "Show in table"
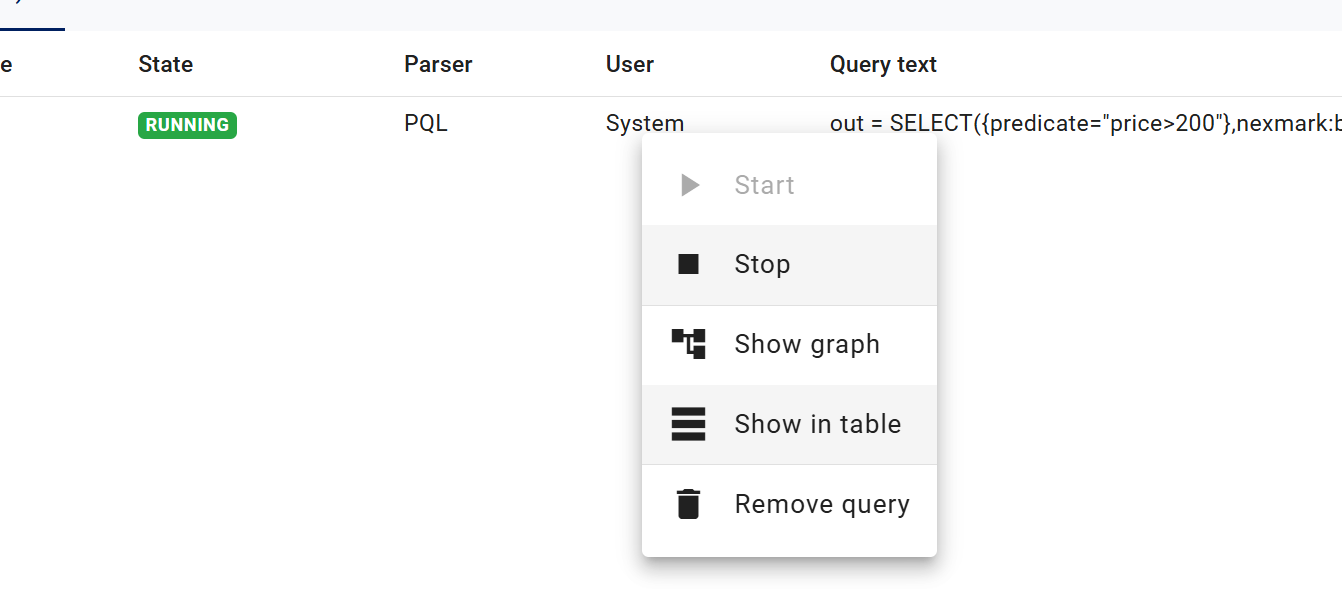
a new window opens at the upper right side and shows the results.
You can use this ![]() icon the show the query plan for this query (Remark. Does not work atm).
icon the show the query plan for this query (Remark. Does not work atm).
An alternative, is to click on the "Monitor" entry in the menu.

There you will see for any installed query, the plan.