The Dashboard-Feature includes Dashboards into Odysseus Studio. A Dashboard is a screen (or view) with multiple query result visualisations. With this, it is possible to customize the appereance of Odysseus for end-users. Due the integration to the project-infrastructure, dashboards are permanently saved. If a dashboard is shown on screen, the underlying queries will be executed automatically to receive results to visualize. If a dashboard is closed, previously added queries will be removed. This makes consistent statistic visualization through multiple Odysseus starts possible.
Installation
To use the Dashboard-Feature, the feature-plugin de.uniol.inf.is.odysseus.rcp.dashboard.feature must be included in the product-configuration. Currently, it contains the plugins de.uniol.inf.is.odysseus.rcp.dashboard, de.uniol.inf.is.odysseus.rcp.dashboard.part and de.uniol.inf.is.odysseus.rcp.dashboard.part.example. The latter contains only one sample DashboardPart. It can be manually excluded if desired.
DashboardParts
A DashboardPart is (as the name says) a part of a Dashboard. One part can be used in multiple Dashboards multiple times if needed. One DashboardPart presents the results of one Odysseus Script visually. Only the results of the last query are considered. DashboardParts are stored as plain XML-Files with prt-Ending.
Create new DashboardParts
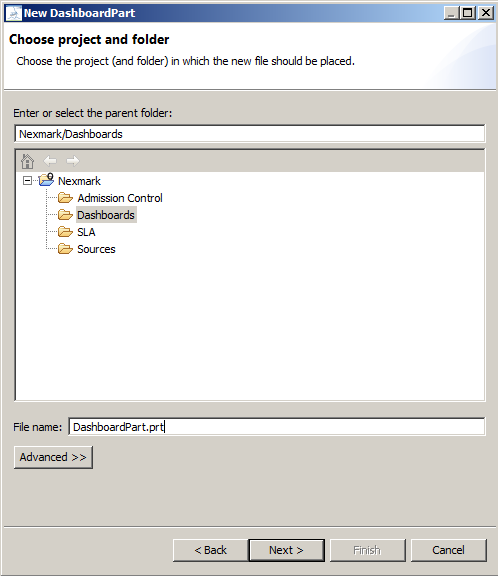
Before creating a new dashboard part, one make sure that the query to use is ready and functional. To create a new DashboardPart, one can use the typical way to add a new file in Eclipse. In the New...-Wizard, the user chooses to add a DashboardPart.. The first step is to specify the project and/or folder to place the new DashboardPart-File. The prt-Ending will be added automatically if not specified by the user.
Next, the type of the DashboardPart must be chosen.
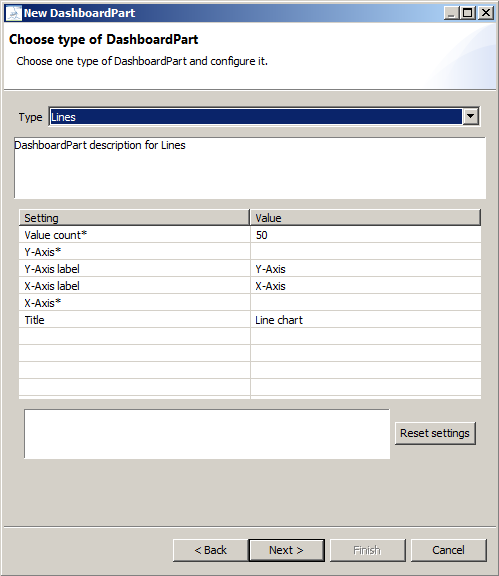
A type describes, how to visualize the query results. It contains a short description and a list of settings to configure the DashboardPart. If a setting has an star ( *) after his name, the setting is mandatory. It is optional otherwise. A more detailed description of currently available types can be seen in Types of DashboardParts.
The last step is to choose the query to execute the receive the results to show.
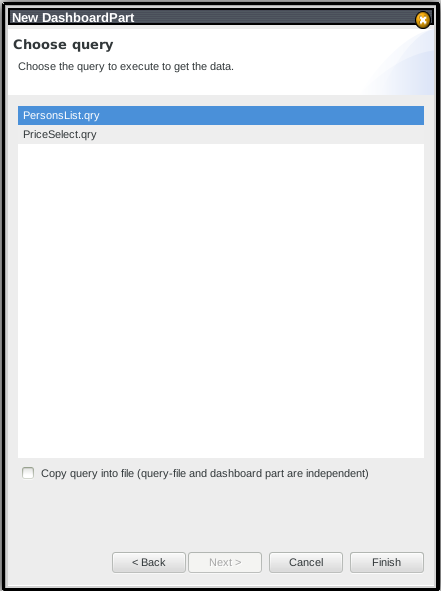
Two possible ways to integrate the query into the dashboard part are possible. If the query is static and should never be changed, the query can be copied into the dashboard part. The resulting part is more consistent and can be later moved easier, if desired. Changes in the query afterwards are not applied to the dashboard part. The other possibility is to link dashboard part with the query. If the query changes (e. g. bugfixes), it will be applied to the dashboard part. After clicking "Finish", the new dashboard part is created at the specified location.
Configure DashboardParts
Remove DashboardParts
Dashboards
As mentioned above, a Dashboard is a container of multiple DashboardParts. Each DashboardPart contains exacly one visualization of a query-script (see Odysseus Script for defining scripts in Odysseus). Dashboards are stored as plain XML-Files with dsh-Ending.
Adding Dashboards
To include a new Dashboard to a project or workspace, the classical way of adding new files in Eclipse can be followed. Either through the 'New'-Menu or by the context-menu in the Project Explorer, new Dashboard-Files can be named and added. At first, a Dashboard is empty. The shown screen is completely white. The next step is to add DashboardParts (see DashboardParts in this article).
Adding DashboardParts to Dashboards
Assuming that a number of DashboardParts already exists in the Workspace, one of them can be added by editing the xml-contents of the Dashboard-file:
<?xml version="1.0" encoding="UTF-8" standalone="no"?> <Dashboard> <DashboardPart file="Relative/Path/To/File.dsh" h="300" w="300" x="100" y="100"/> </Dashboard>
A graphical way to add DashboardParts to Dashboards is planned.
Layout
There are two ways to position and scale the DashboardParts. One possibility is to change the coordinates, width and height in the file directly (see above code). It is obvious, that x and y stands for the coordinates (in pixels, with (0,0) in the top-left corner of the editor-view). h describes the height of the DashboardPart, w the width (both also in pixels). The second way is to "steer" the DashboardParts: by selecting one in the Dashboard, it can be positioned and scaled with the arrow-keys:
| Strg + Arrow-Keys | Positioning |
| Strg + Shift + Up/Down | Change height |
| Strg + Shift + Left/Right | Change width |
It is planned to position and resize with the mouse cursor.
Removing DashboardParts
To remove one DashboardPart from the Dashboard, the only possibility is to remove the corresponding line from the xml-file. A keybind is planned.