...
Then you could use Odysseus in grafana as a datasource.
You will need to provide the server-adress: e.g. with ws://localhost:8888/
ATM there are some shotcommings that will be removed in future versions:
You will need to determine the websocket address manually by using a webbrowser (we recommend Firefox because of better JSON presentation) (http://localhost:8888/queries/<nr>) and find the section websockets with protocol JSON and use the entry with uri for creating panels in grafana:
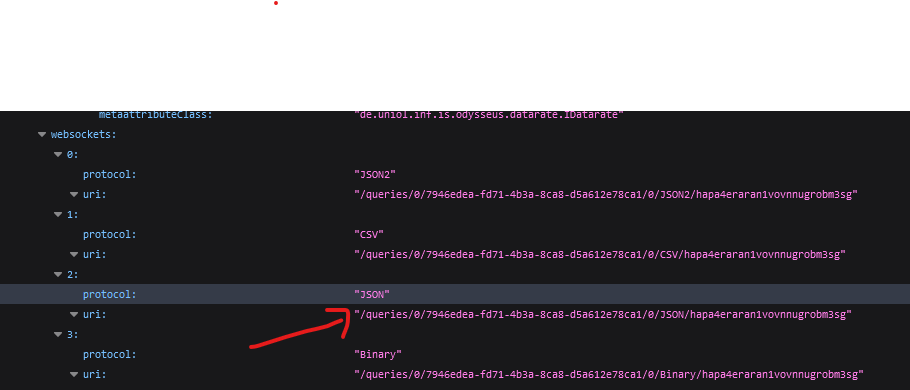
The output of the connected query
- should contain an attribute named time with a milliseconds timestamp (typically this should be a current timestamp for grafana)
- all other attributes should be numeric attributes