The evaluation feature offers some graphical user interface and instrumentation to measure the latency and throughput of a given query and to create some plots.
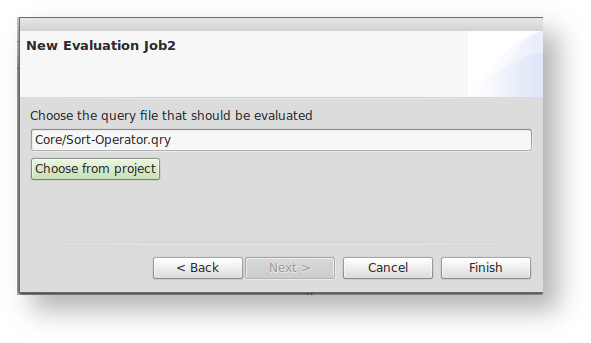
Create a new evaluation
Before the evaluation feature can be used the features monolithic.studio and latency have to be added to the odysseus product.
...
Settings for an evaluation
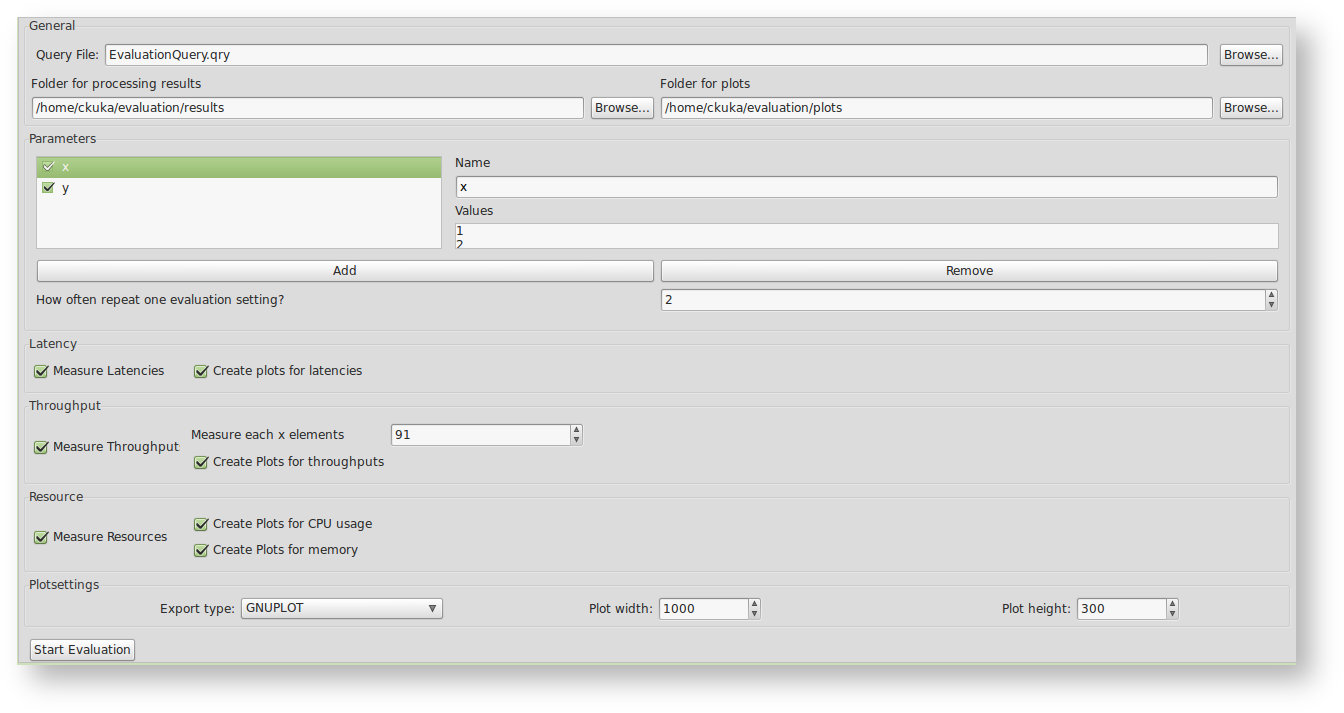
Query File: This is the query file you want to evaluate. It should deliver at least one executable, physical query plan. Remember that the query will be executed more than once, so you should design the script to be reexecutablere-executable. This means for example, the query file may not try to install new sources which are already installed. Hint: you may use something like "#DROPALLSOURCES" or "#IFSRCDEF/#IFSRCNDEF" in Odysseus Script.
Folder for processing results:This is a the folder where the evaluation dumps the results. For each new run of an evalationevaluation, a new subfolger subfolder (named by date and time) is created.
Folder for plots: If you want to create plots from the results, the created plots are saved here.
Parameters: These parameters can be used to iterate over certain settings (or values) in your query file. If you created a new evaluation job, you have two predefined examples: "var_1" and "var_2". "var_1" is the name of the variable and the values are given at the right (each line is a value). So the predifined parameter "var_1" has the values "a", "b" and "c" and "var_2" the values "x", "y", and "z". If the parameters are active (the checkbox is checked), the evaluation will iterate over the values. It will produce each possible combination of all active parameters. For this example there will be 9 different runs:
...
Measure Latency: If it is activated, the evaluation job adds the his pretransformation pre-transformation handler to measure the latency of the query. The pretransformation pre-transformation handler changes the query files (e.g. it activates the metadata latency by adding "#METADATA Latency" to the query. Furthermore, it adds the LatencyCalculationPipe and a FileSink to each root operator of the query. Therefore, if your query has different sinks, you will also have different latency results.
...
Measure Throughput: If this is active, the evaluiation evaluation job adds his pretransformation pre-transformation handler to measure the throughput of a query. The pretransformation pre-transformation handler changes the query by adding a throuput throughput operator after each source.
...
Create plots for throughput: If activated, the evaluation will use the merged files to create some plots, which are stored within the plot-folder (look above).
Measure Resources: If this is active, the evaluation job adds his pre-transformation handler to measure the CPU and memory consumption. The pre-transformation handler changes the query by adding the "#METADATA Systemload" directive to the query.
Create plots for CPU: If activated, the evaluation will use the merged files to create a plot of the CPU consumption.
Create plots for memory: If activated, the evaluation will use the merged files to create a plot of the memory consumption.
Plotsettings: You can choose the export type: PDF, PNG, JPEG, or GnuPlot. Furthermore you may define the dimension of the plot, its height and width.
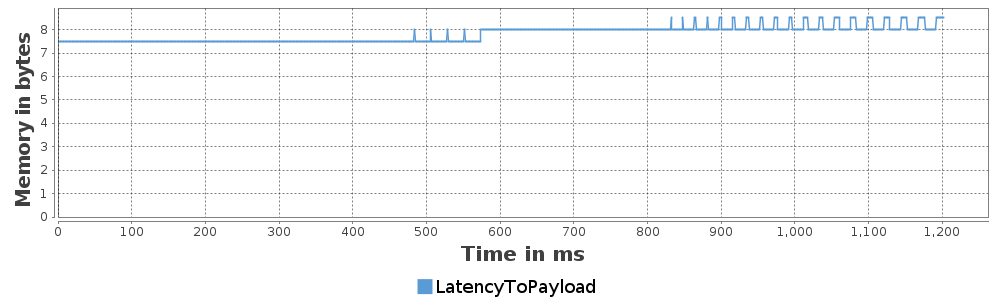
If the export type is PDF, PNG, or JPEG the resulting plot will look like the figure above. If the export type is chosen to be GNUPLOT, the evaluation feature will generate a .dat file with the merged measurements and a .gnu file containing a GNUPLOT script to generate a LaTeX file.
Run and stop the evaluation
...
To stop an evaluation you may click "Cancel" on the Progressmonitorprogressmonitor.
If you stop a query by hand (e.g. using the Queries view) - one evaluation run is canceled and the next run will be installed and started automatically.
...