...
you will see the following output (when no other query is running!):
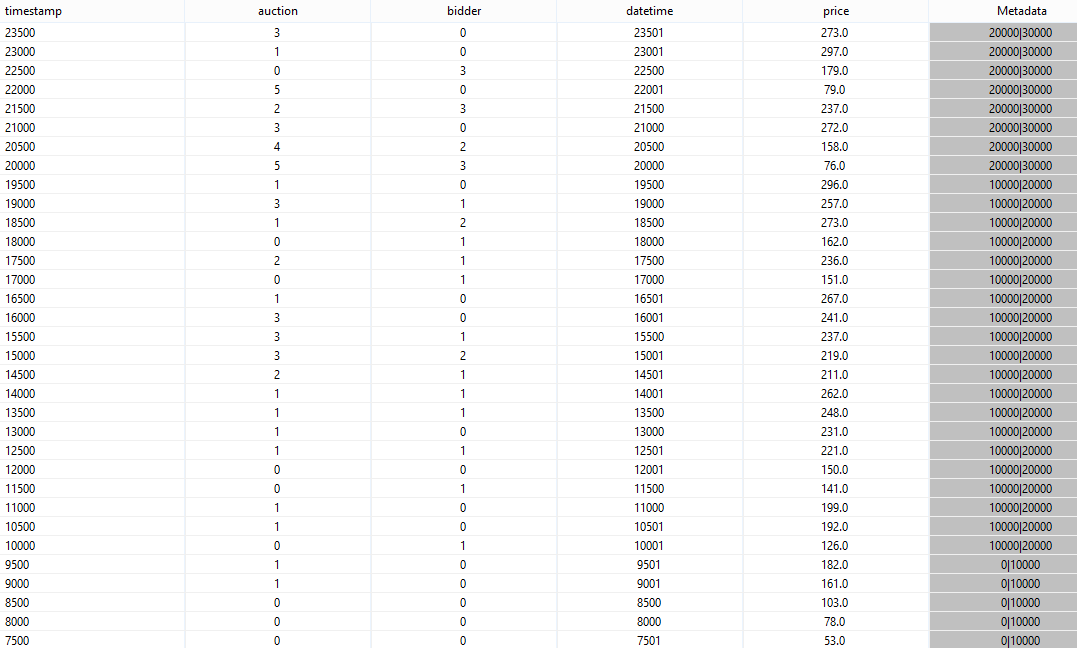
As you can see, the aggregations count up to 20 and then start again at 1. This is not exactly, what the provider wanted. The problem here is, that the elments have different start time stamps and only those parts of the elements are aggregated where the time intervals overlap.
A way to cope with this is to use another parameter called SLIDE. With slide all start timestamp are set to the same value. This can be interpreted as reducing the granularity of the time domain.
So remove all queries. A start a new PQL query (timewindow3)
| Code Block |
|---|
#PARSER PQL
#TRANSCFG Standard
#ADDQUERY
out = TIMEWINDOW({SIZE=10000, SLIDE=10000},nexmark:bid) |
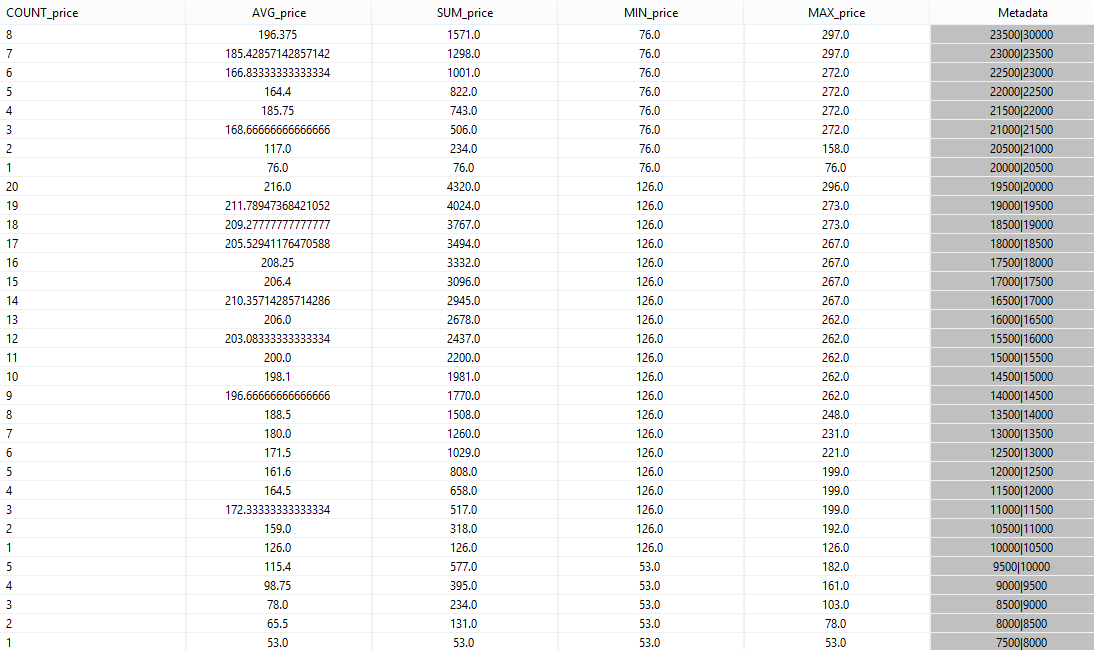
After starting this query, you should see something like:
Now you can see, that for one window all time intervals are the same.
If we now run the following query (window_aggregation3):
| Code Block |
|---|
#PARSER PQL
#TRANSCFG Standard
#ADDQUERY
windowed = TIMEWINDOW({SIZE=10000, SLIDE=10000},nexmark:bid)
out = AGGREGATE({
          aggregations=[
            ['COUNT', 'price', 'COUNT_price', 'integer'],
            ['AVG', 'price', 'AVG_price'],
            ['SUM', 'price', 'SUM_price'],
            ['MIN', 'price', 'MIN_price'],
            ['MAX', 'price', 'MAX_price']
          ]
        },
        windowed
) |
You will get the following output:
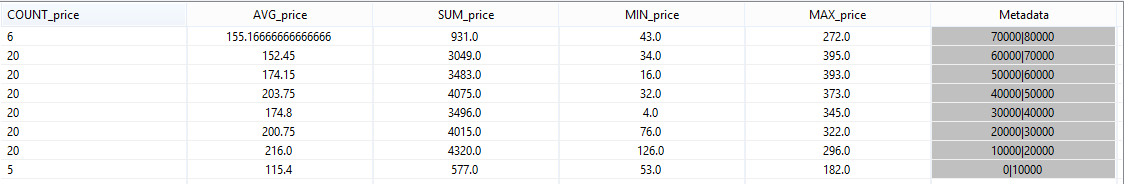
Note: You could ignore the first line, it was created because when the query was stopped.
Here you can see the aggregation over 10 second intervals.