...
You can visualize the vessels with their trajectories on a map.
Adding a simple stream with location data
To do this, we first need a simple data stream from our vessels. Therefore, we can use this simple query:
| Code Block |
|---|
#PARSER PQL
#RUNQUERY

/// For the map view
out = TIMEWINDOW({
          size = [60, 'MINUTES']
        },
        System.SanFranciscoAIS
) |
Add a new map
Next, we create a map. Right click on your project / folder in the Project Explorer and choose "New" → "Other ..." → "Odysseus Map". When you created the map, you should see an empty grid. Next, we will add a background map from a tile server. We have a few predefined tile-servers you can use. You should see "Map Layer" and "Map Connection" on the right as you can see in the figure below. If you don't see these, you can add them via "Window" → "Show View" → "Other" and then select them.
![]()
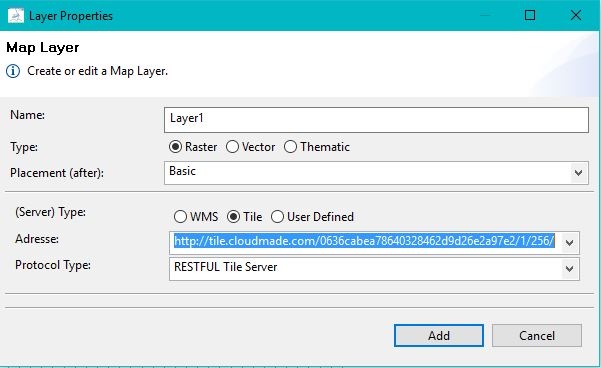
Add a tile server
On the layers view, we click "Add" and choose the "http://tile.cloudmade.com/0636cabea78640328462d9d26e2a97e2/1/256/" tile server.
Now we should be able to see a world map. You can now zoom in to San Francisco where the vessels will appear after the next step.
Add the map connection
Future Work
The work on this topic is not finished. Here list of things that we want to add in future releases.
...