...
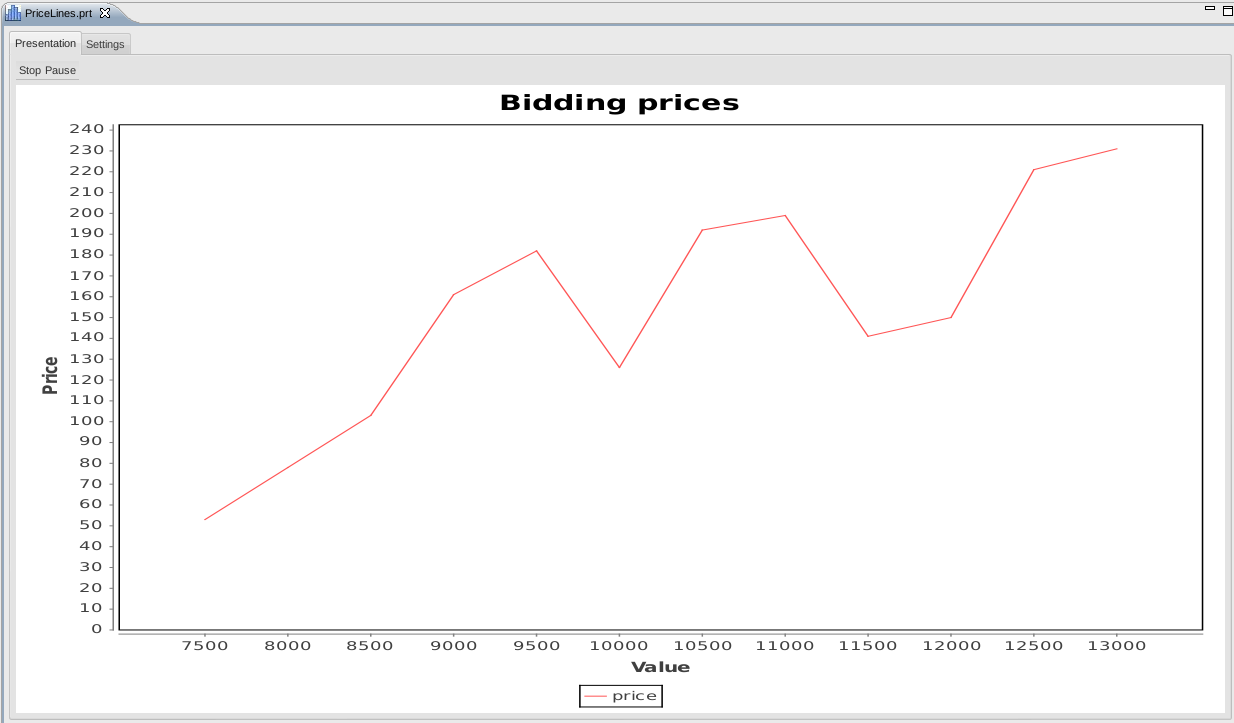
To show a dashboard part, a simple double-click on the corresponding prt-File is needed. If the underlying query can be executed without errors, the editor area shows the graphical its graphical result. At the top, two tabs are shown. The first is the presentation tab, showing the graphical results mentioned. The second tab, the settings-tab gives an overview about the settings configuring the dashboard part. Depending on the type of the dashboard part and setting, the setting can changed here to apply improvements. Which settings are editable is shown in Types of DashboardParts. If a setting is changed, the changes applies immediately in the presentation tab (depending on the implementation of the dashboard part). At least, closing and reopening the prt-File applies the changes.
Remove DashboardParts
...
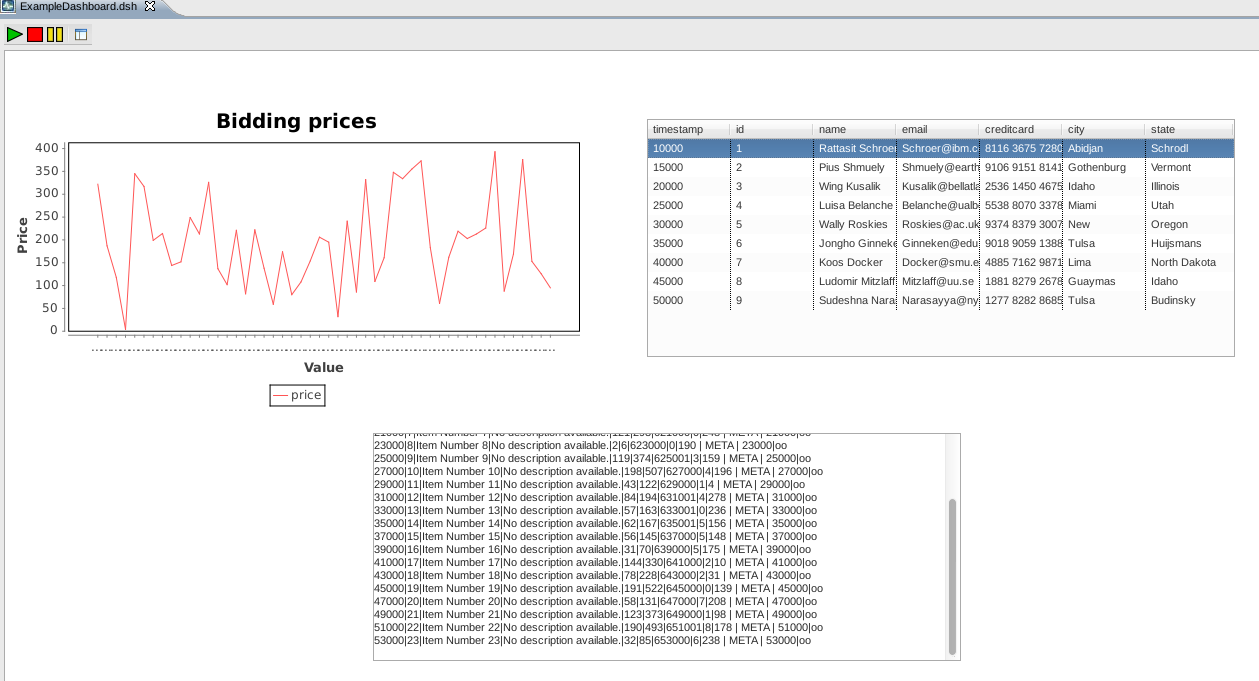
As mentioned above, a Dashboard is a container of multiple DashboardParts. Each DashboardPart contains exacly one visualization of a query-script (see Odysseus Script for defining scripts in Odysseus). Dashboards are stored as plain XML-Files with dsh-Ending.
Adding Dashboards
To include a new Dashboard to a project or workspace, the classical way of adding new files in Eclipse can be followed. Either through the 'New'-Menu or by the context-menu in the Project Explorer, new Dashboard-Files can be named and added. At first, a Dashboard is empty. The shown screen is completely white. The next step is to add DashboardParts (see DashboardParts in this article).
...